Creative
Creative Analytics
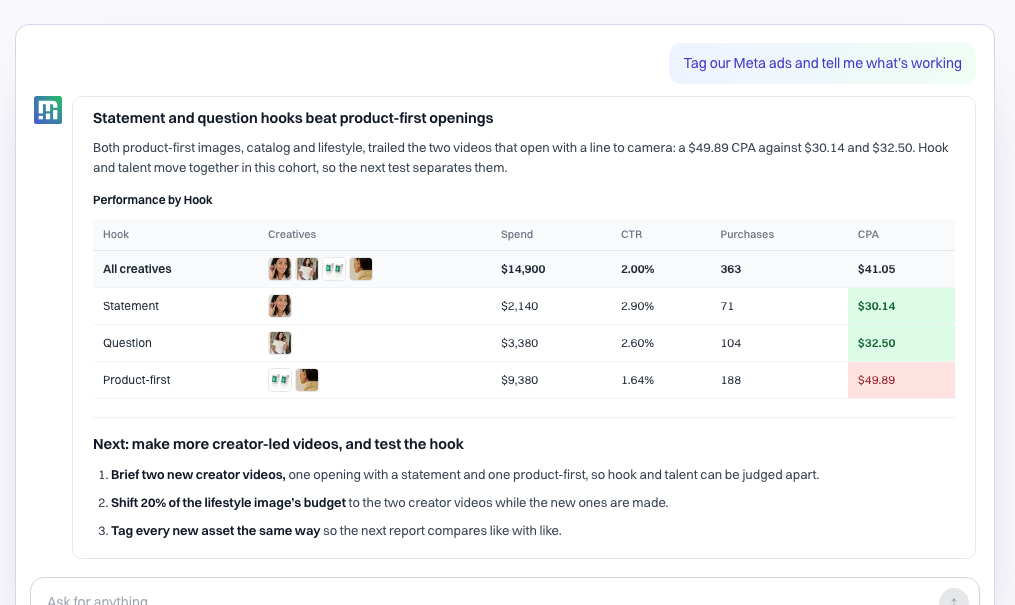
Creative analytics answers the question campaign reporting cannot: not which campaign is working, but which ad, and what about it is working.
What you can ask
- Which creatives drove the results this month, and what they cost per outcome
- Which attributes win — a hook, a format, a talent type, an offer — rather than which individual ad got lucky
- Which ads are tiring: click-through falling, cost rising, spend still going in
- Whether a winner on one platform travels to another
- What to make next, and why
A view you can shape
Creative performance is a dashboard you arrange rather than a report someone else designed. Filter by creative type, placement or tag; choose which metrics to show; sort by the one you care about; set thresholds so the outliers stand out; and switch between the grid, a table and the aggregated view.
 Facebook2026-08-22 – 2026-09-21✓ Save viewPublished
Everyday earrings, elevated. Meet the pair…
- Spend
- $11.76
- Clicks
- 27
- CTR
- 10.38%
- CPC
- $0.44

Everyday luxury that lifts the ordinary…
- Spend
- $31.84
- Clicks
- 51
- CTR
- 8.12%
- CPC
- $0.62

Everyday luxury that lifts the ordinary…
- Spend
- $46.19
- Clicks
- 66
- CTR
- 7.33%
- CPC
- $0.70
Each creative carries its tags and its own trend lines, so you can see the ad and its numbers together rather than matching a row in a spreadsheet back to an image.
When a view is worth keeping, save it. Publish it and the rest of your team sees the same thing, without rebuilding the filters.
Reports and decks you can send
The same numbers come out as something you can hand over: a written report, a slide deck for the monthly review, or a dashboard someone can open themselves. Download it, or have it posted to Slack or emailed on a schedule.
How it is put together
Performance comes from the ad platforms and, where you have connected it, from your store or analytics, so a creative is judged on outcomes rather than on clicks. Attributes come from tagging: every ad is labelled, so the comparison is like with like.
Where it shows up
- As an answer, when you ask
- As a weekly or monthly report, delivered where your team works
- As the reasoning behind a proposal: what to scale, what to retire, what to make next